
Executive Summary
- Most of the October 19 ETF inflow has left again, and ETF trading volume has stayed low since May.
- Long-term holders own a large block of coins bought above $85K, and new bids on the Binance book have moved down to $78K-79K.
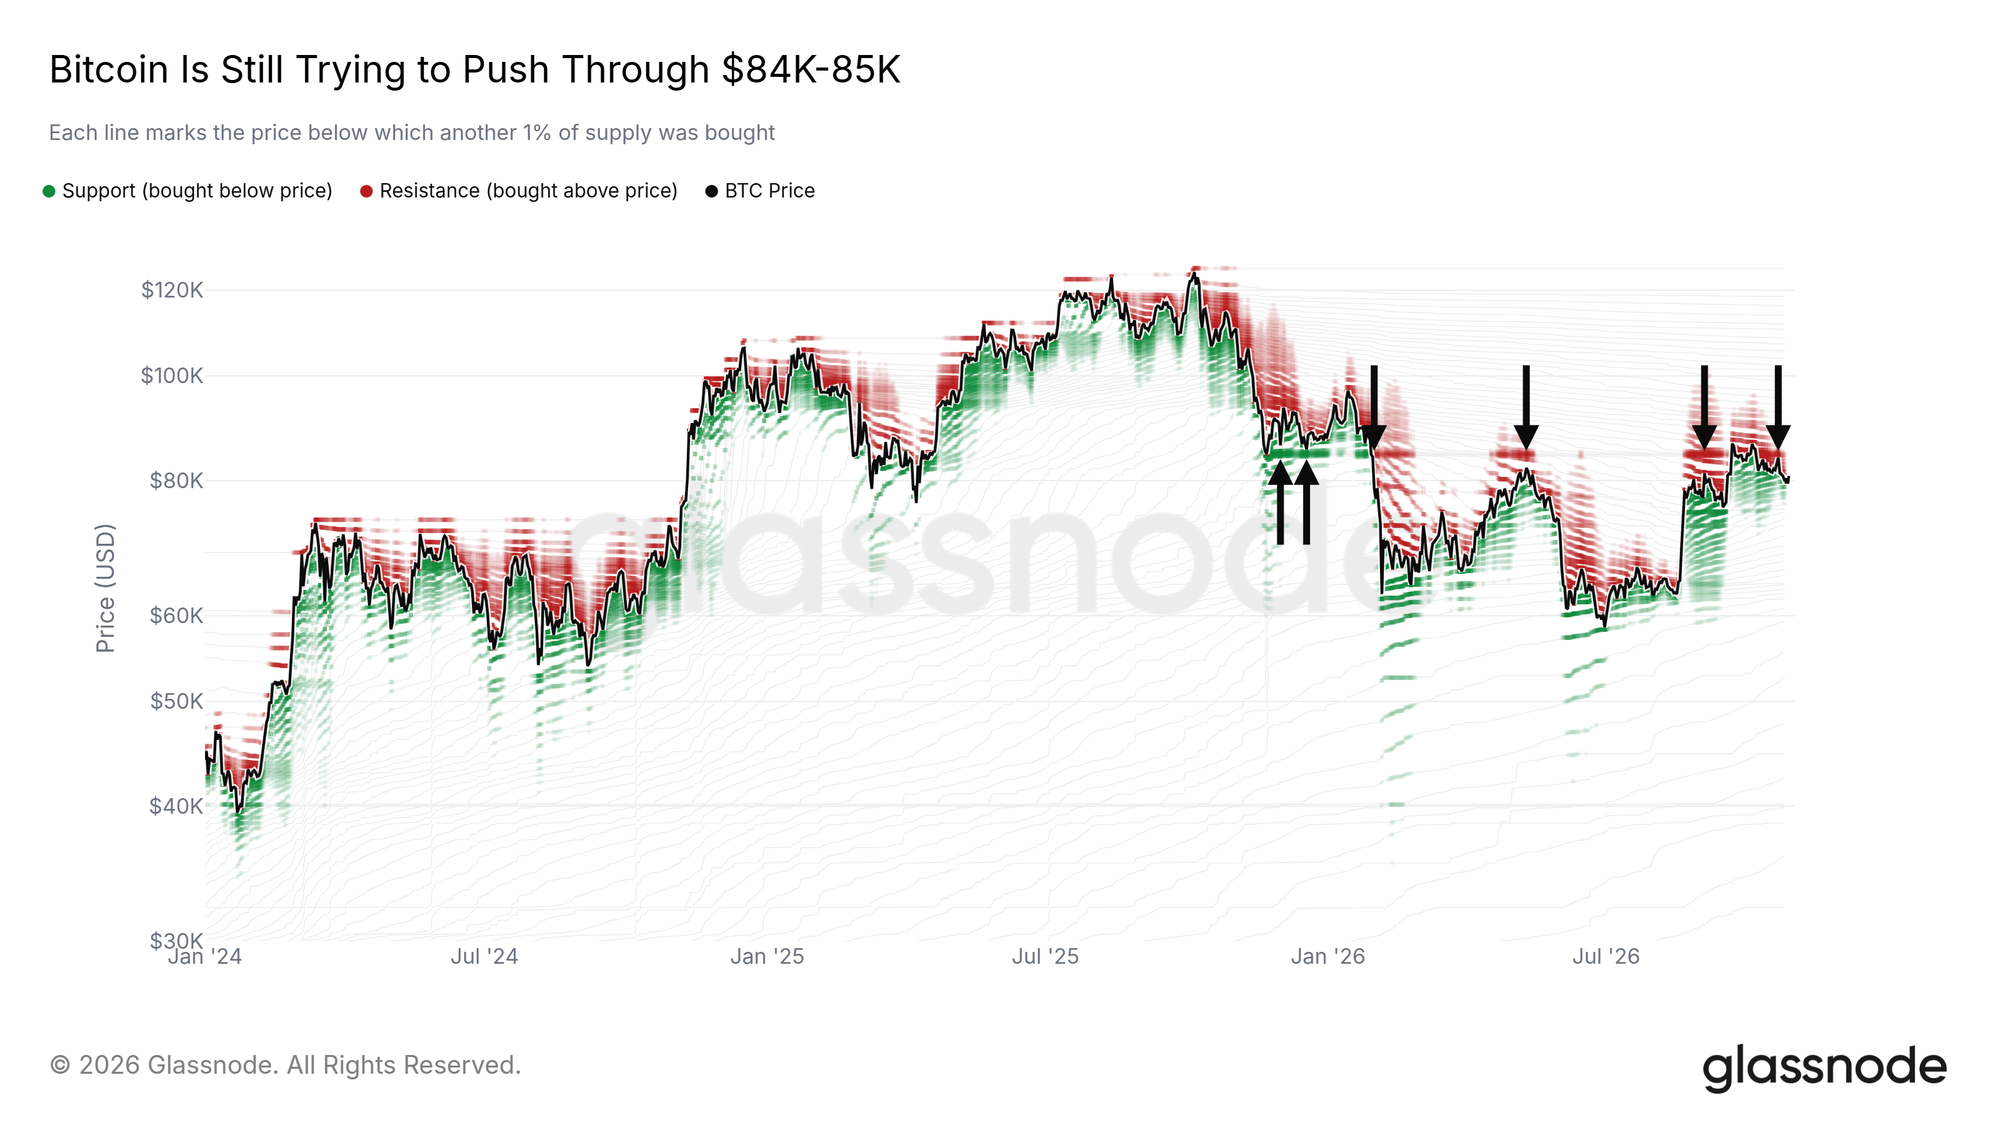
- The $84K-85K band has turned Bitcoin back four times this year, and price has slipped just under the US Spot ETF Cost Basis.
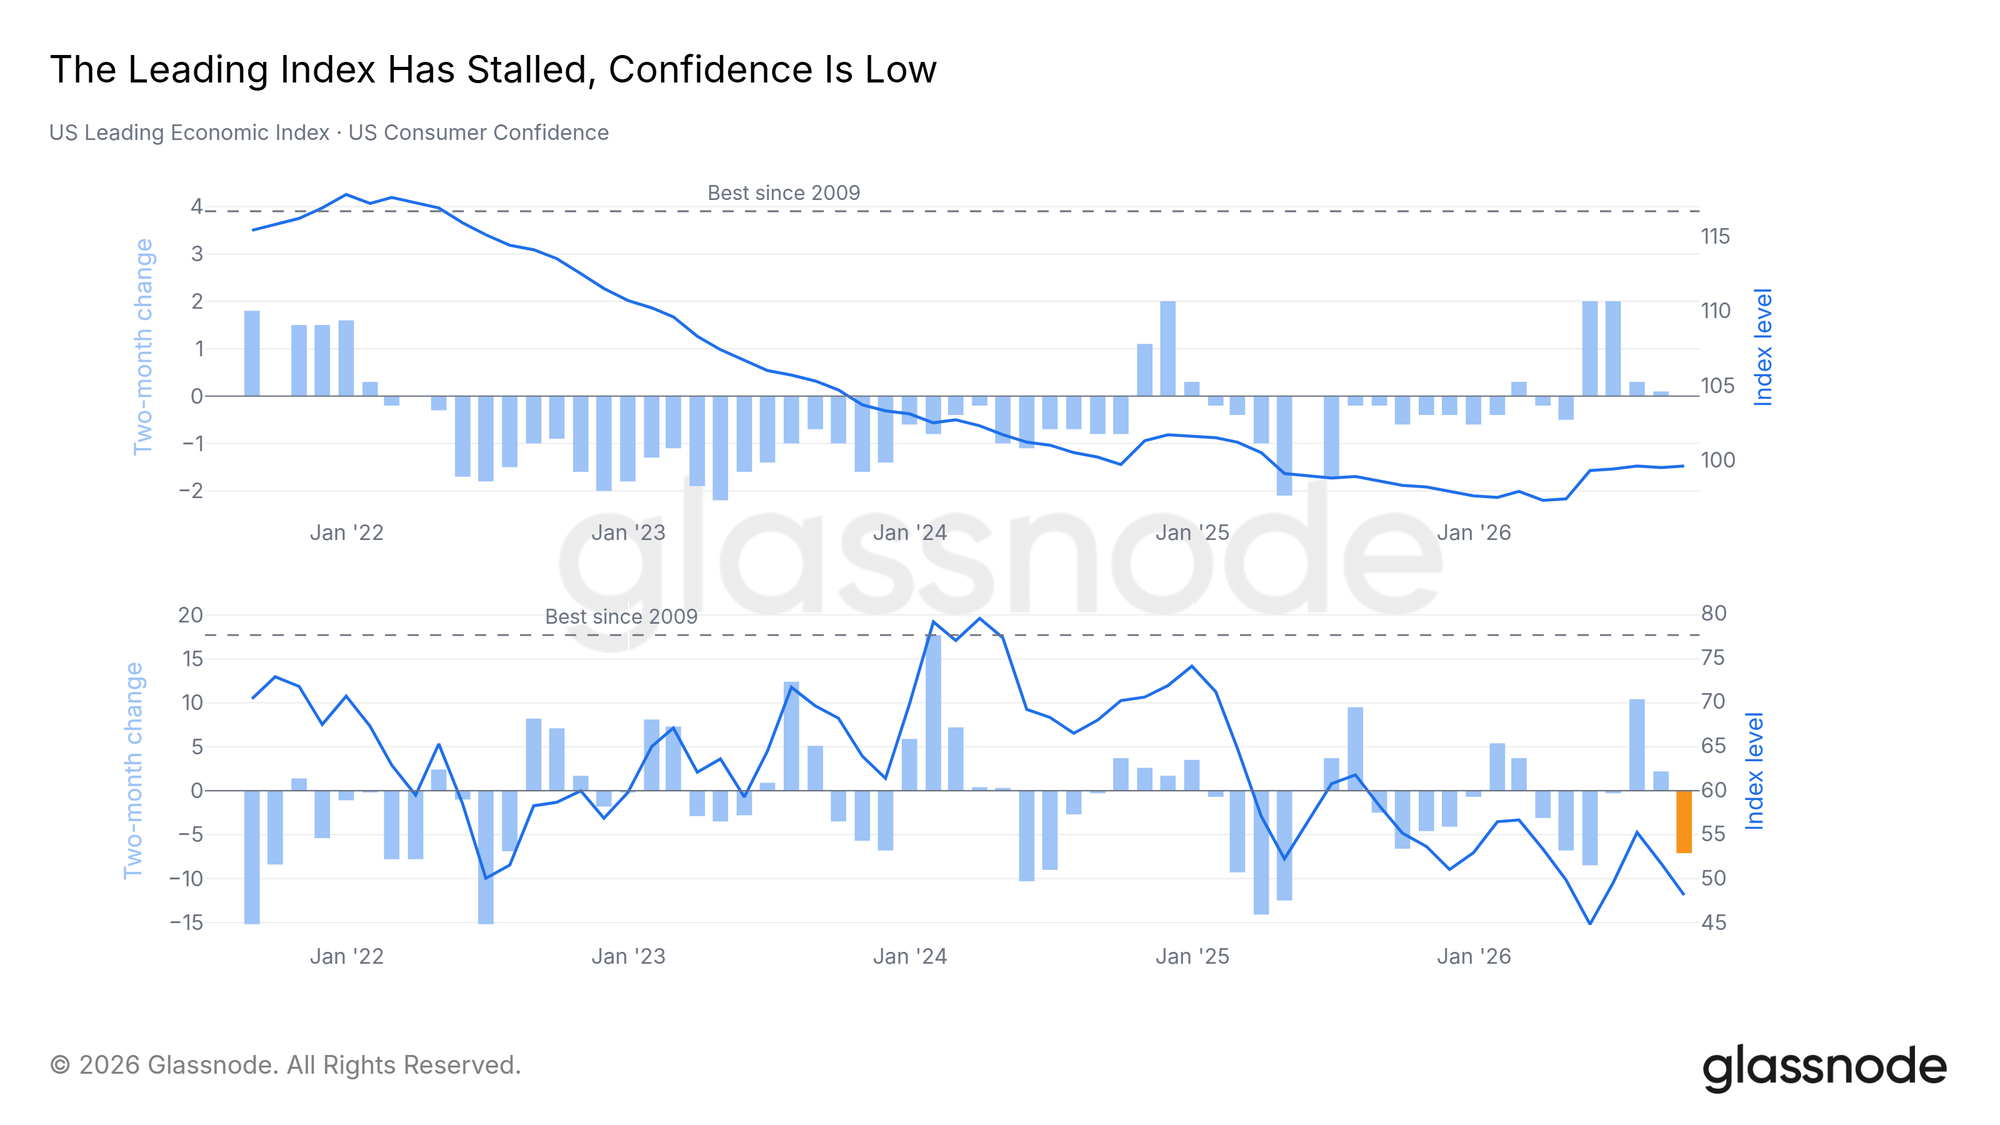
- The US Leading Economic Index has stalled and Consumer Confidence is close to its lowest since 2009, ahead of the Fed decision.
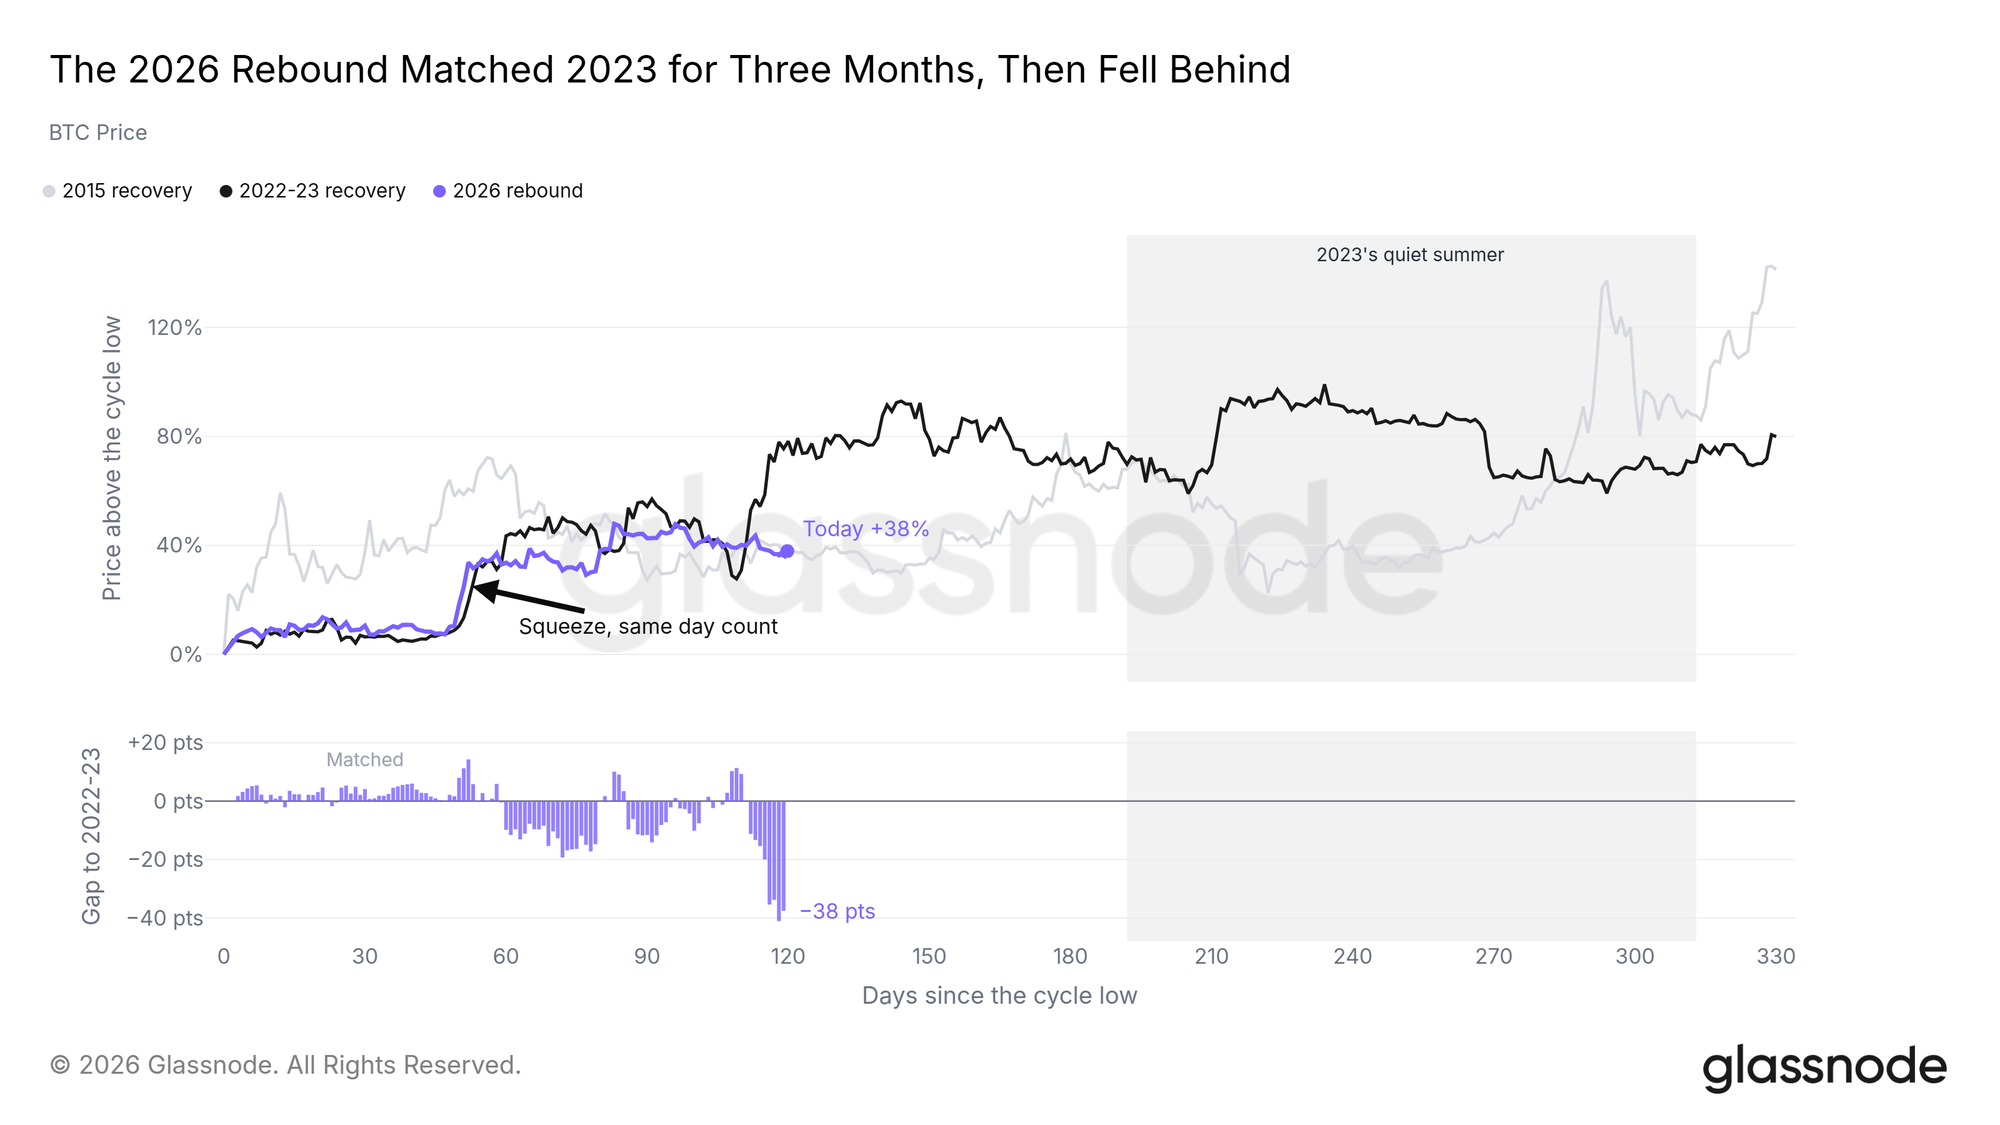
- Bitcoin's rebound followed 2023 for about three months, then fell behind, but more wallet groups are adding than in summer 2023.
- Volatility is back to summer 2023 levels, and Bitcoin has been calmer on only about 5% of days since 2015.
- Each dip since August has realized smaller losses, and once one entity's internal transfer is left out, profit taking is still light.
- On Hyperliquid, trading in stocks, indices and commodities again tops the venue's Bitcoin perpetual volume.
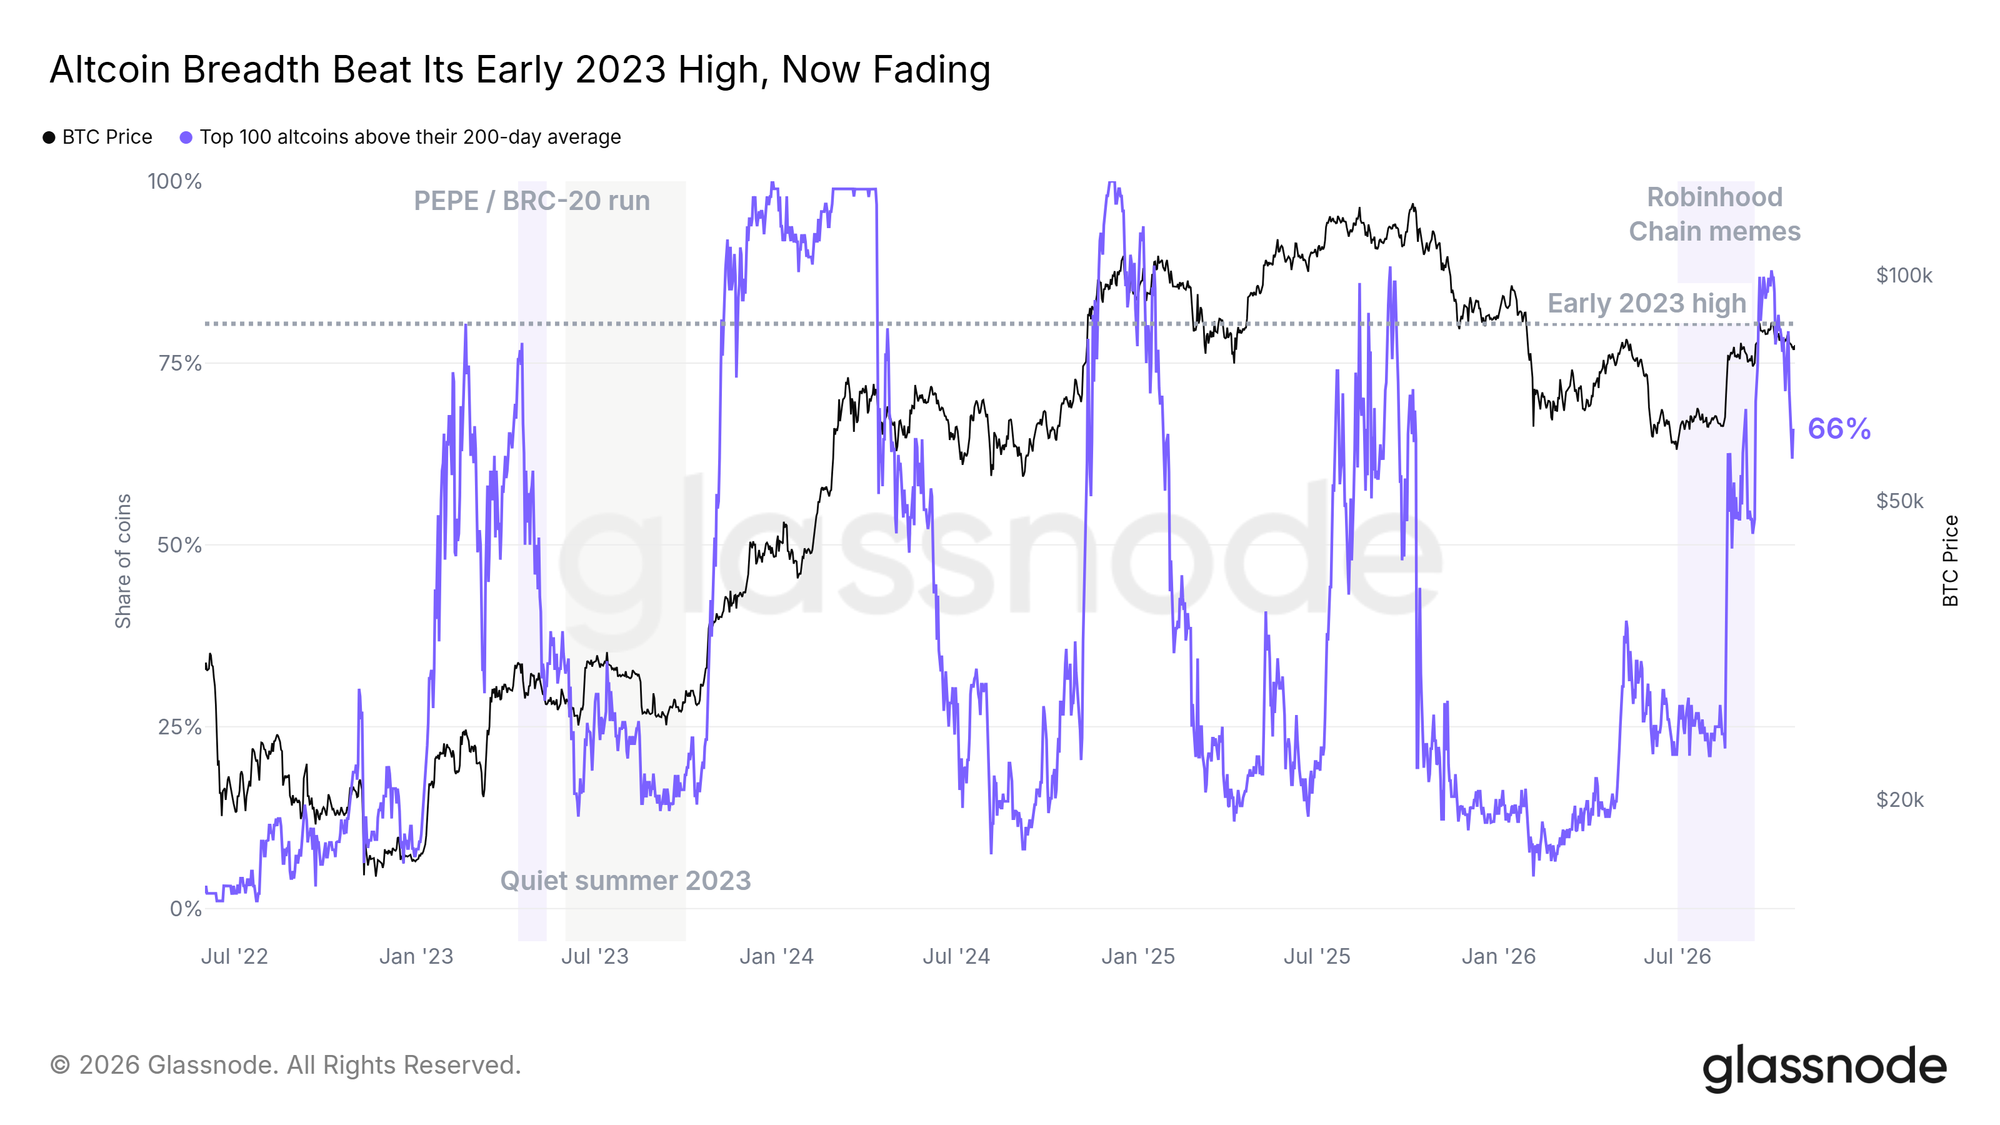
- The share of top-100 altcoins above their 200-day average peaked above its early 2023 high in early October and has fallen since.
Ready to get ahead of markets and sharpen your foresight? Try Glassnode. Sign up or talk to sales.
The ETFs Net Out
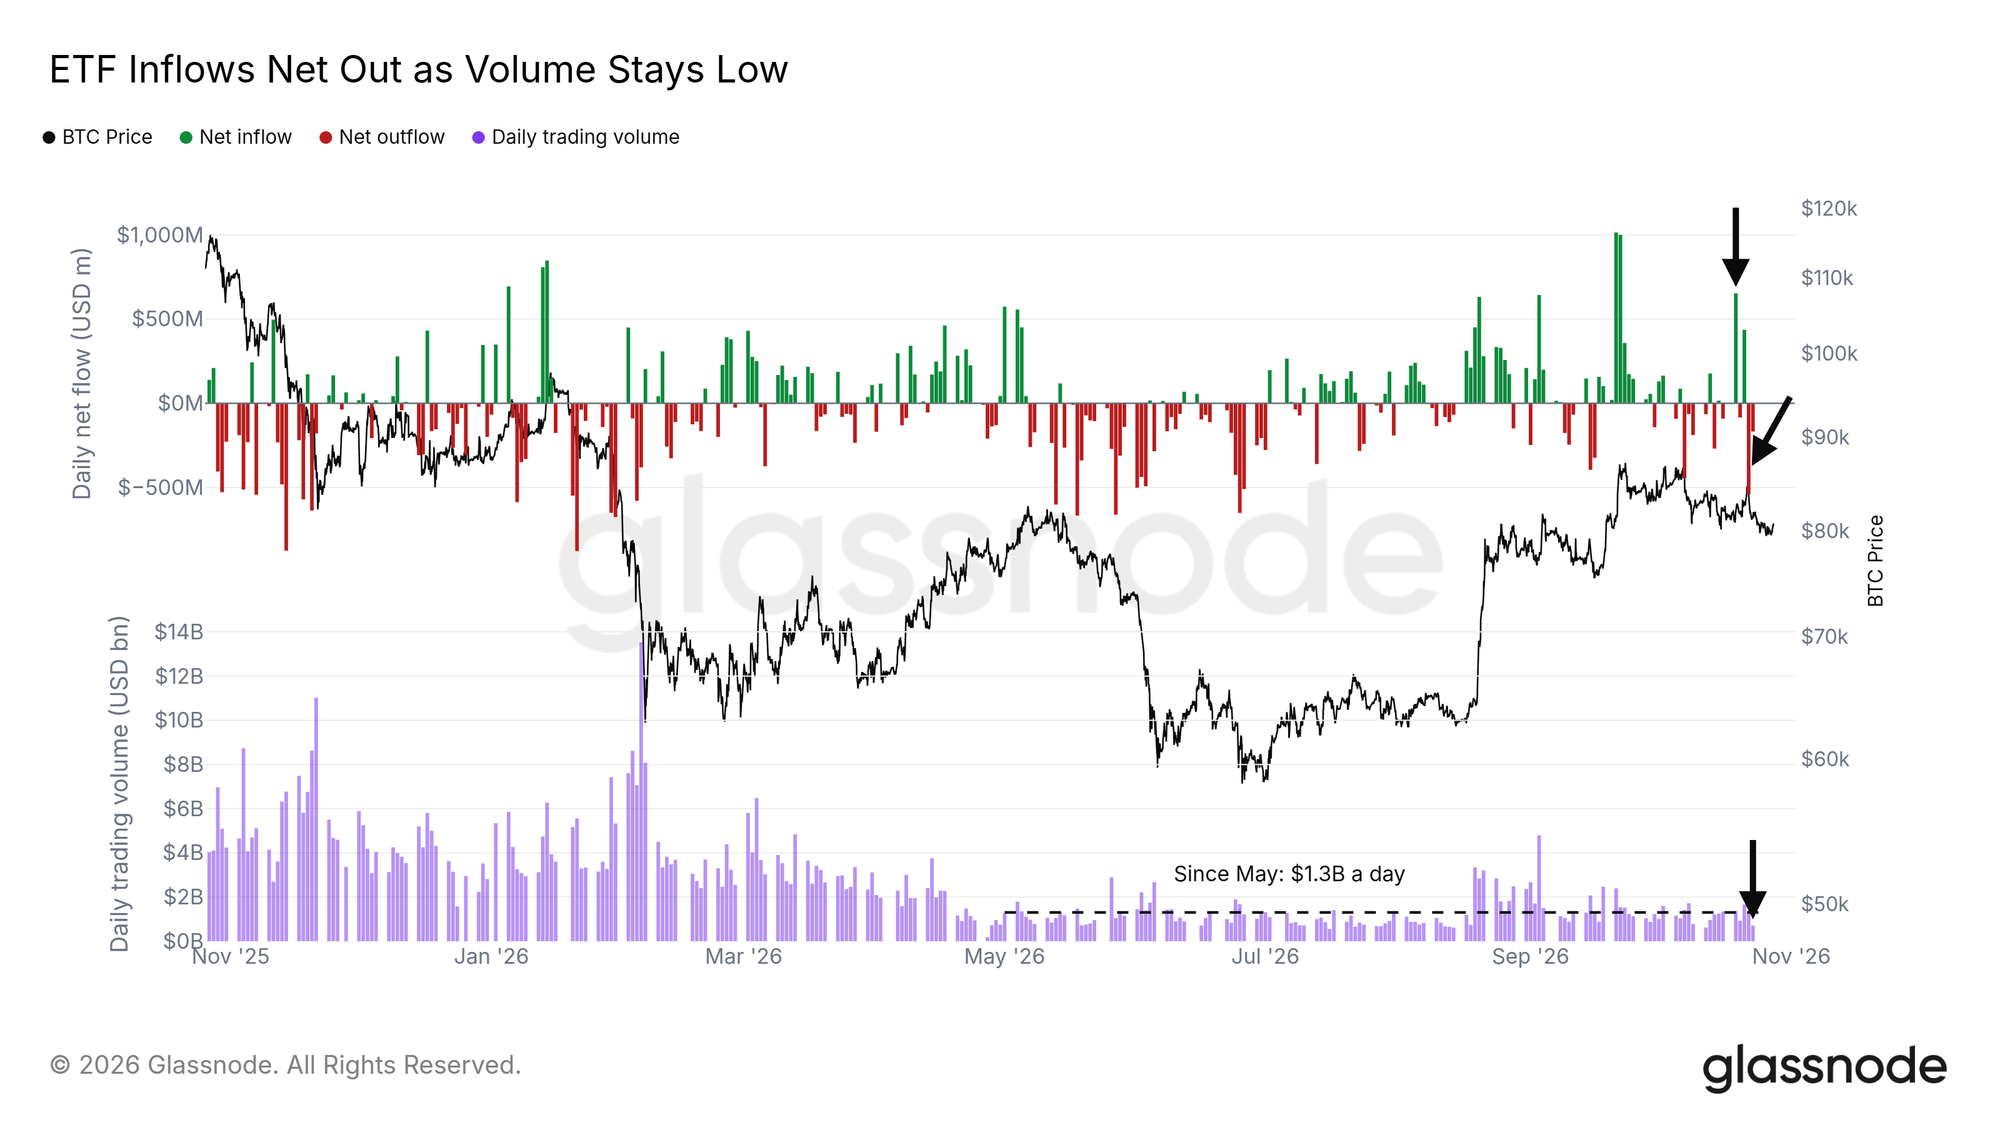
Last week we covered the $653M that flowed into the US spot ETFs on October 19. Most of it has since left again, including $540M on October 22, and over the past two weeks the funds took in just $67M net.
Trading in the ETFs has been thin for much longer. Since the start of May, they have traded about $1.3B a day, well below the months before. On October 23, volume fell to about $700M, one of the quietest sessions of the year. With flows flat as well, this suggests the ETFs are adding little demand at current prices. Price is also close to what the average ETF holder paid, as we show below. Should inflows return on rising volume, it would show that demand is coming back.
Holders Frame the Range
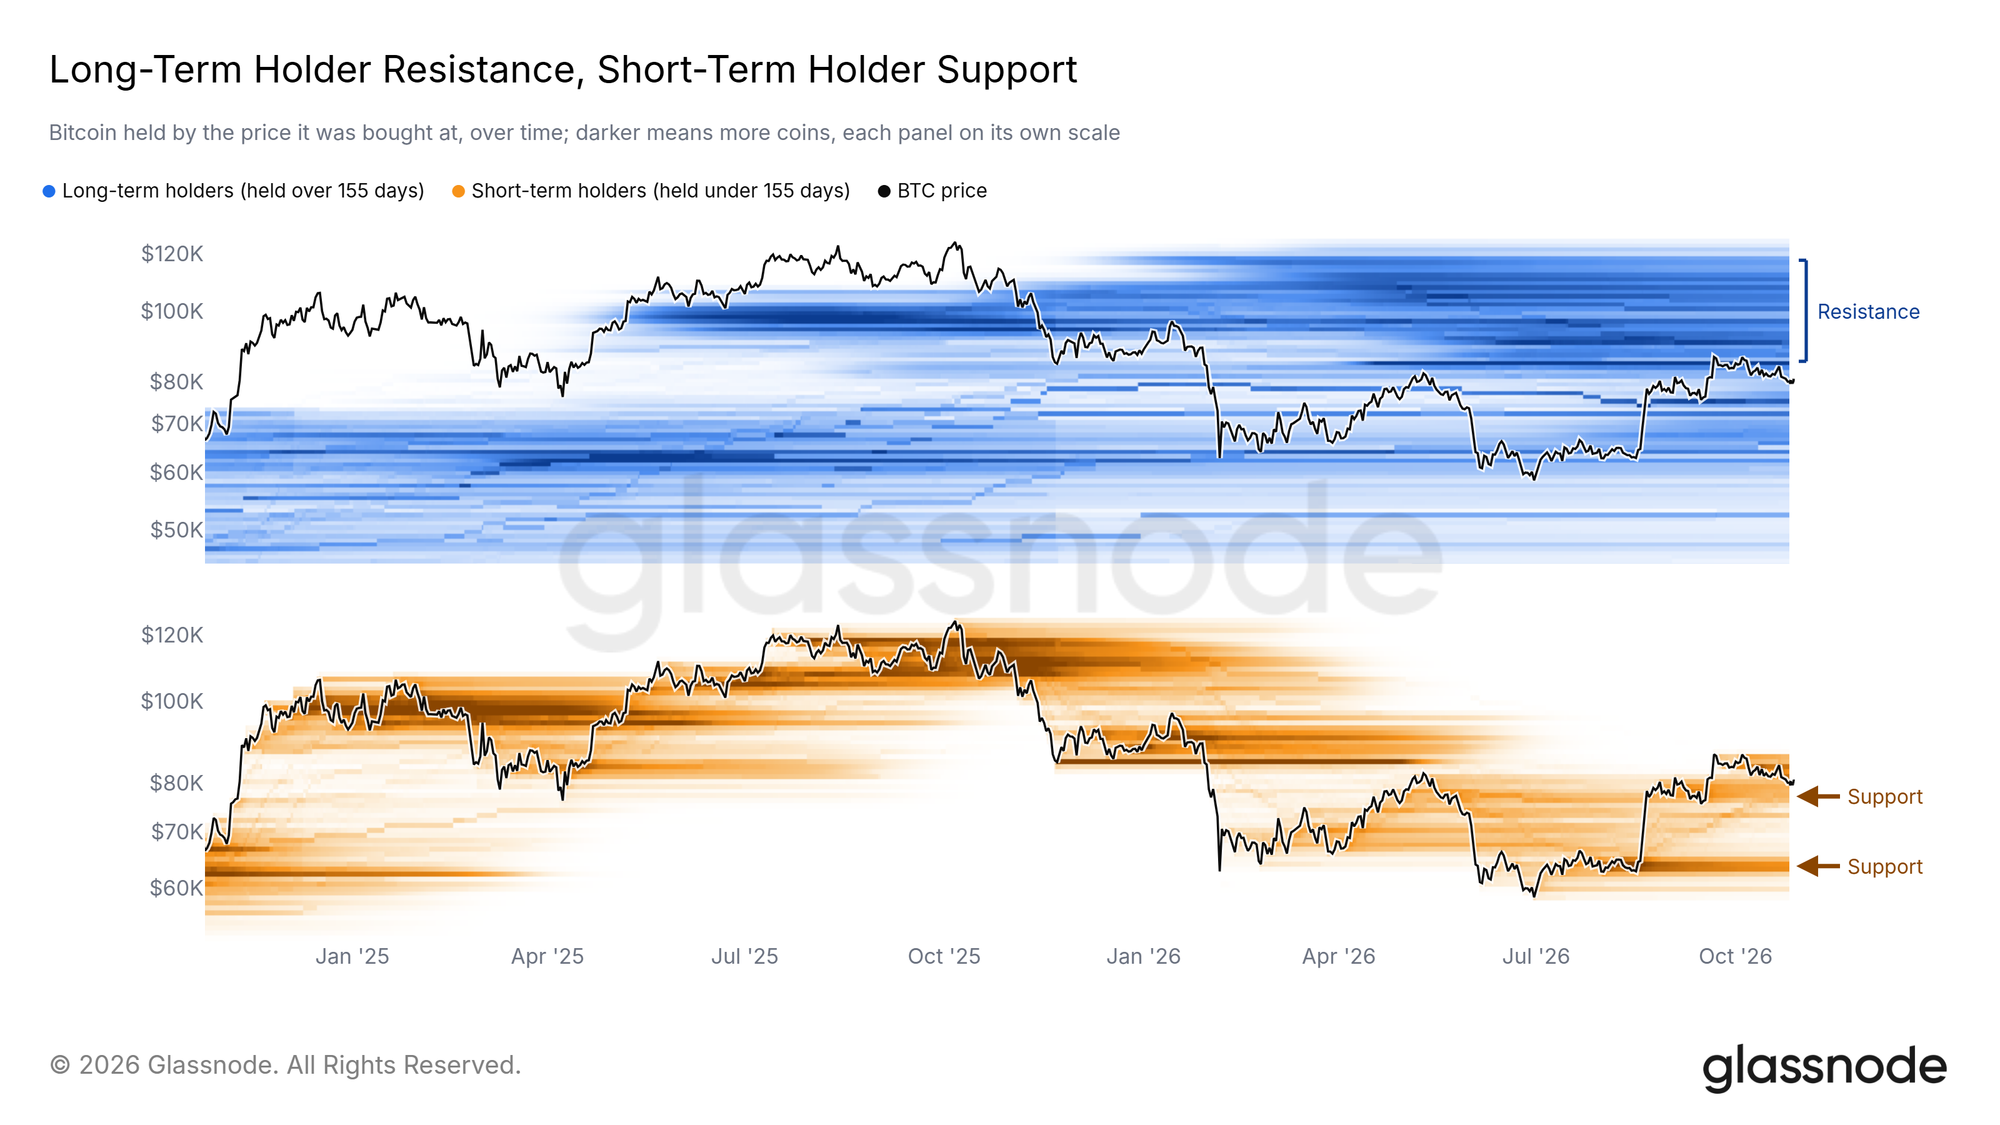
We can see where holders break even in the Cost Basis Distribution, which groups coins by the price at which they last moved. Long-term holders, those holding for more than 155 days, own a heavy block of about 4M BTC, bought between $85K and $118K, mostly in 2025. More than half of all their coins were bought above today's price. If price recovers toward $85K, many of these holders may sell to get their money back.
Most short-term holder coins, on the other hand, were bought below today's price. The densest part lies near $77K, with a second cluster around $64K from the 2026 lows. On a dip, these newer buyers are the most likely to defend those levels.
The Next Bid Wall
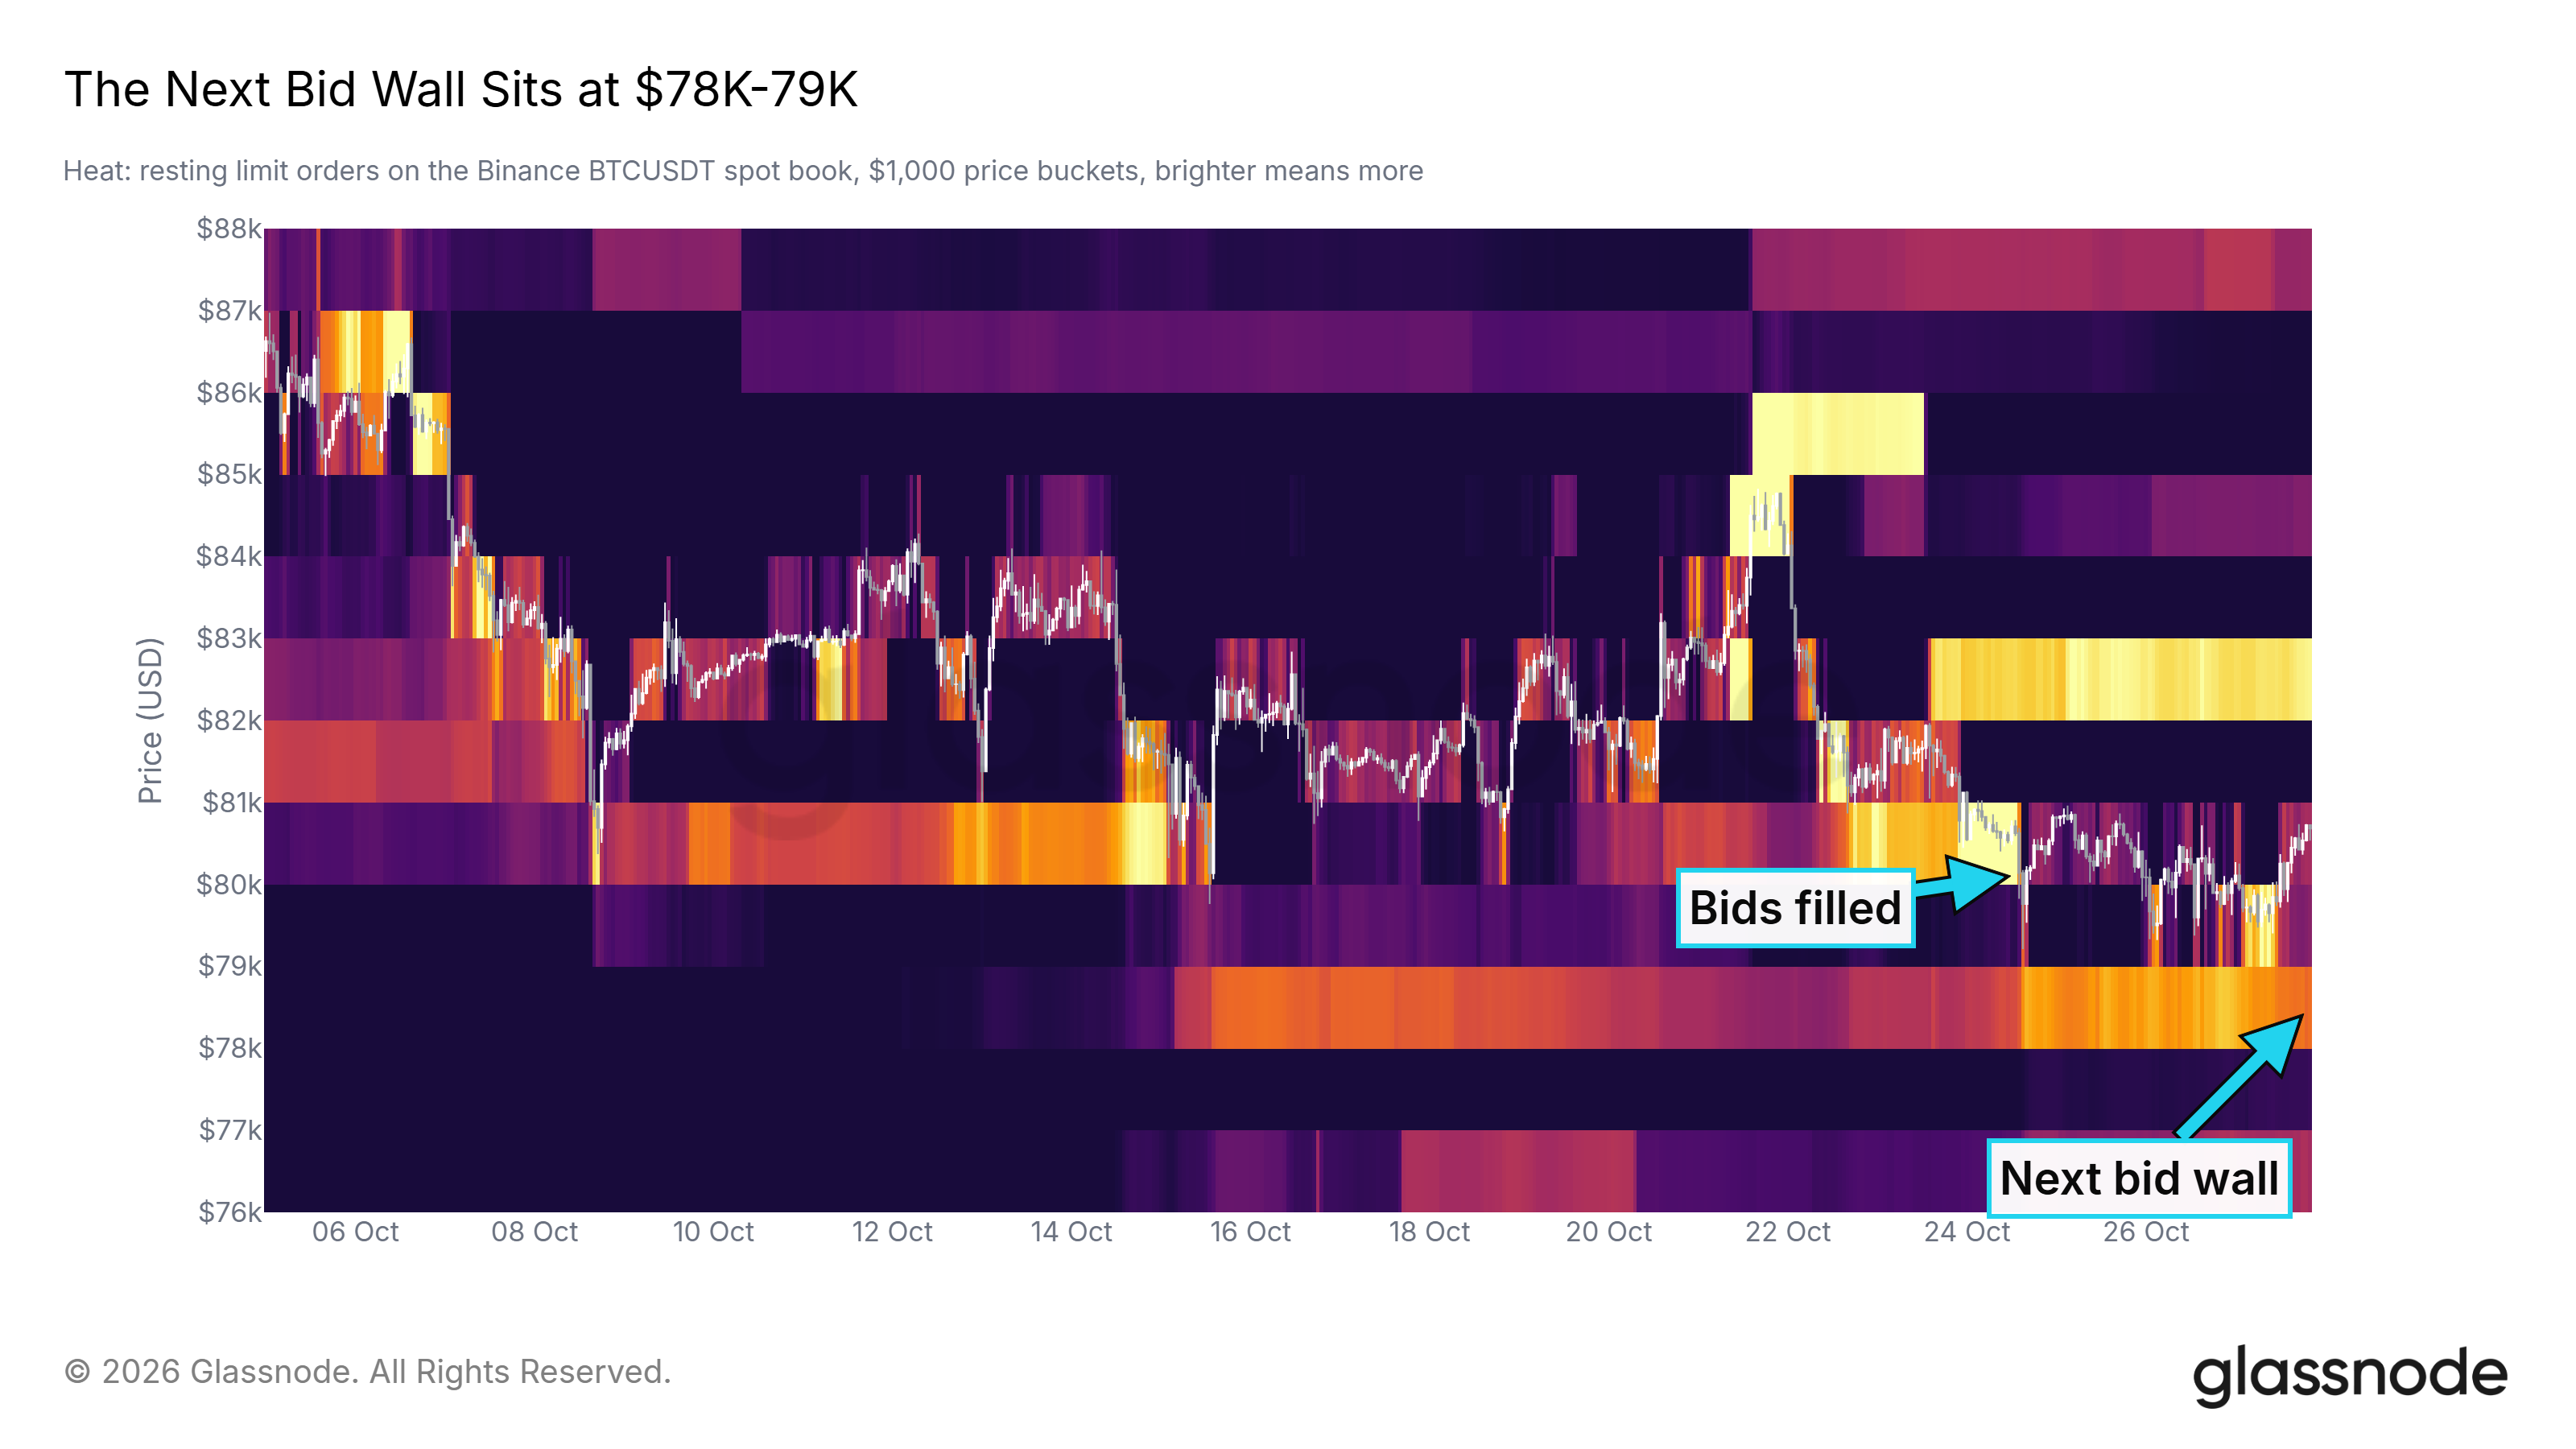
As we noted last week, the bids at $80K on the Binance spot book refilled after the October 15 sweep. The October 24 sweep took them out again, and this time they have not returned. Only $3.4M in bids remains at $80K.
The bids have moved down to $78K-79K, where orders add up to about $42M, up from about $24M in mid-October. That is the largest block of bids near price, and the first place where we would expect buyers to step in on a dip.
The $84K-85K Band
About 4.3% of all Bitcoin last moved between $84K and $85K. Note that most of it moved on a single day, November 22, 2025, when one large holder shifted coins between its own wallets. Even so, price has respected the band since. It held as support in December, when price bounced off it on December 1 and December 18. It gave way on January 31, when a push back up to $84K failed, and Bitcoin fell about 20% over the following days.
Since then the band has acted as resistance, stalling rallies at or just under it in May, in early September and on October 21. Bitcoin did climb above it around the September high, peaking at $87.1K on September 23. But since January it has closed above the band on only five days, never more than three in a row. A run of daily closes above $85K would turn the band back into support.
Between Two Cost Bases
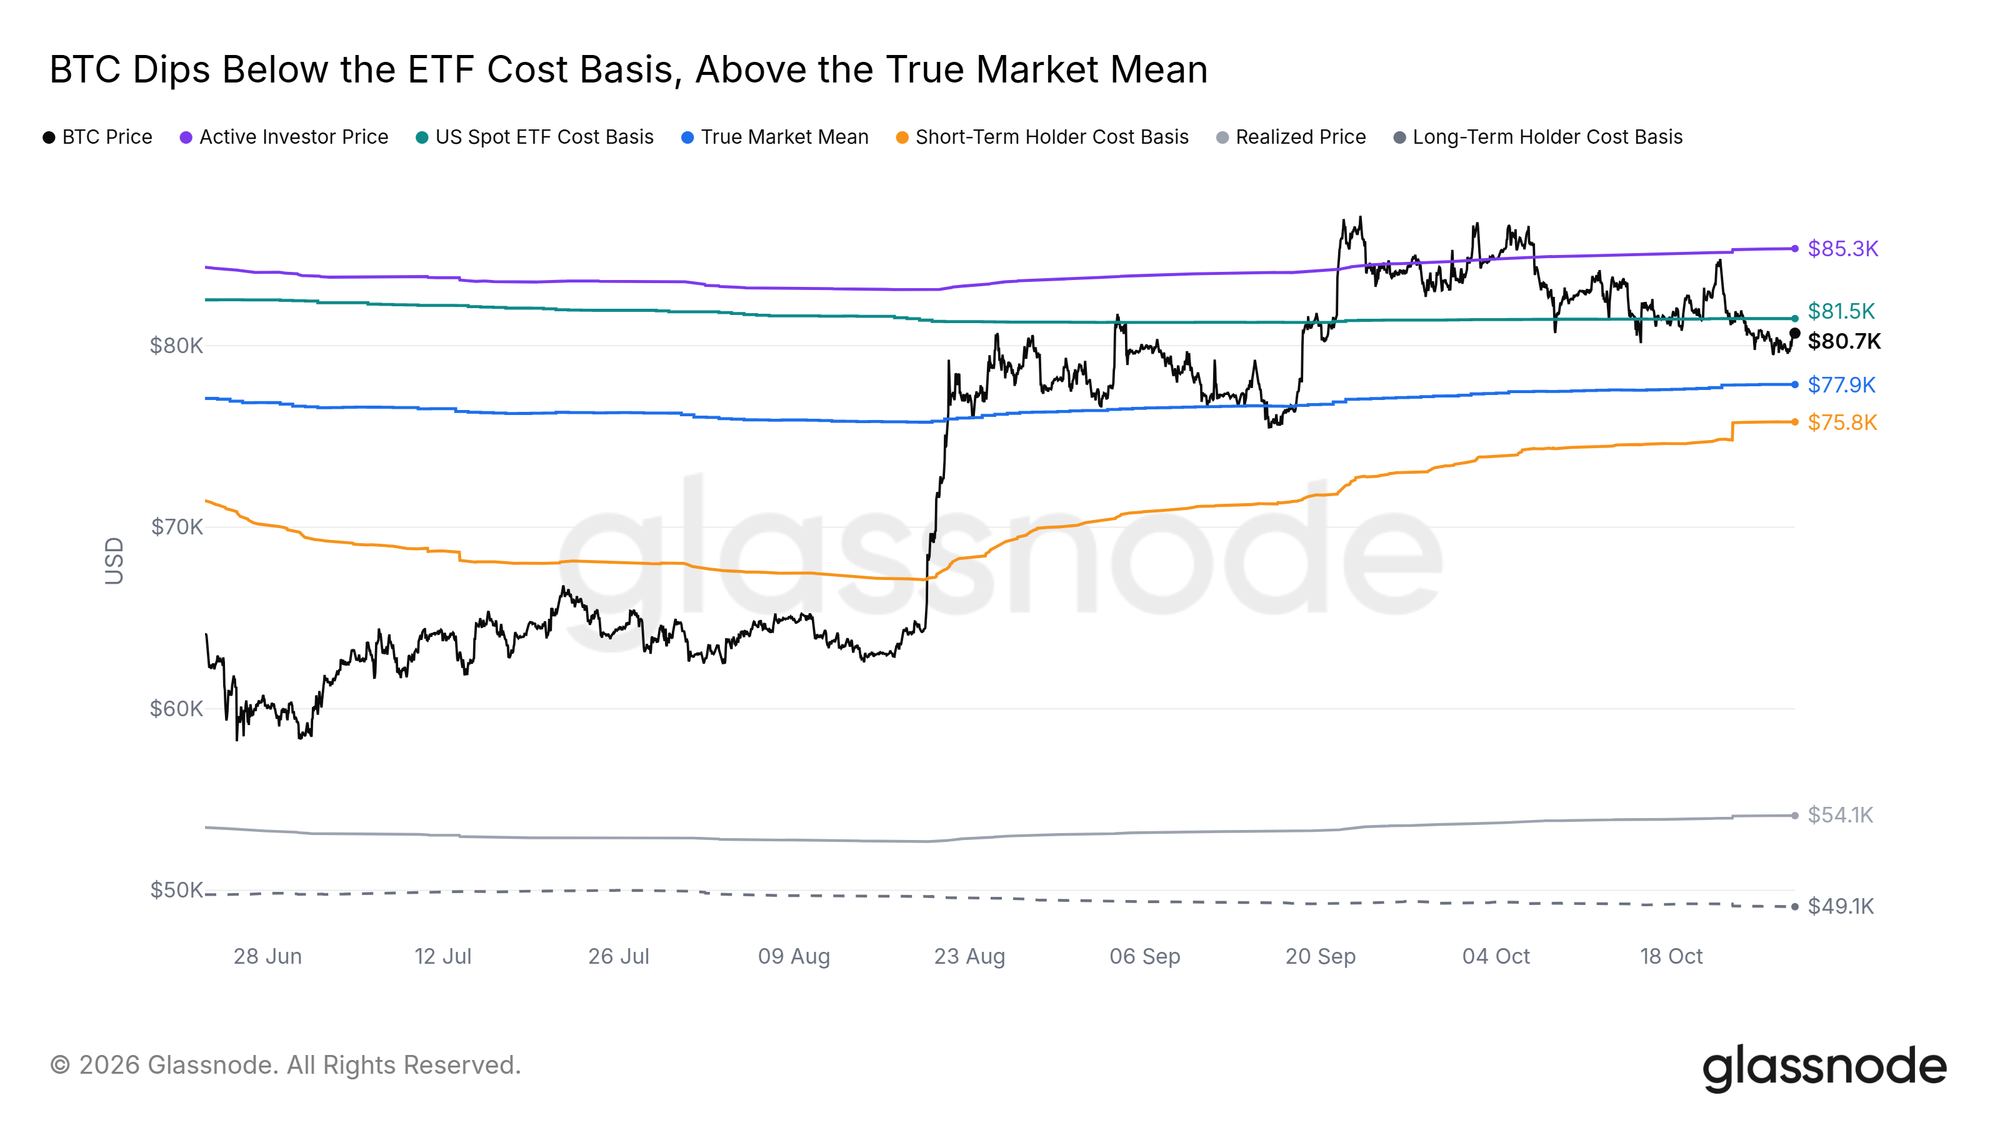
Bitcoin has slipped just under the US Spot ETF Cost Basis, the average price the ETFs paid for their coins, at $81.5K. Below it lies the True Market Mean, the average cost basis of active investors, at $77.9K, and price has stayed above it through both October sweeps. The Short-Term Holder Cost Basis, the average price paid by newer buyers, is lower still at $75.8K. A daily close back above $81.5K would put the average ETF holder back in profit.
Growth Stalls Before the Fed
The US Leading Economic Index, a composite of forward-looking indicators, has stopped improving. Its September reading matched July's, after a rise earlier in the summer. US Consumer Confidence fell 7.1 points over the same two months, to 48.1, close to its lowest level since 2009.
That is the backdrop for the Fed decision on October 28. The Fed raised rates by a quarter point on September 16, its first hike since 2023. Should it hike again, it would tighten conditions further for risk assets, Bitcoin included, just as growth stalls and confidence weakens. The 2023 analog below also unfolded under a hiking Fed, which raised rates for the last time that cycle in July 2023.
Falling Behind 2023
Counted from each cycle low, Bitcoin's 2026 rebound followed the 2022-2023 recovery for about three months. Both saw a short squeeze at the same point, around day 50, when traders betting on a fall were forced to buy back. Since then, 2026 has fallen behind. Bitcoin is now 38% above its June low; at the same stage in 2023, price was 75% above its low.
Wallet Groups Split
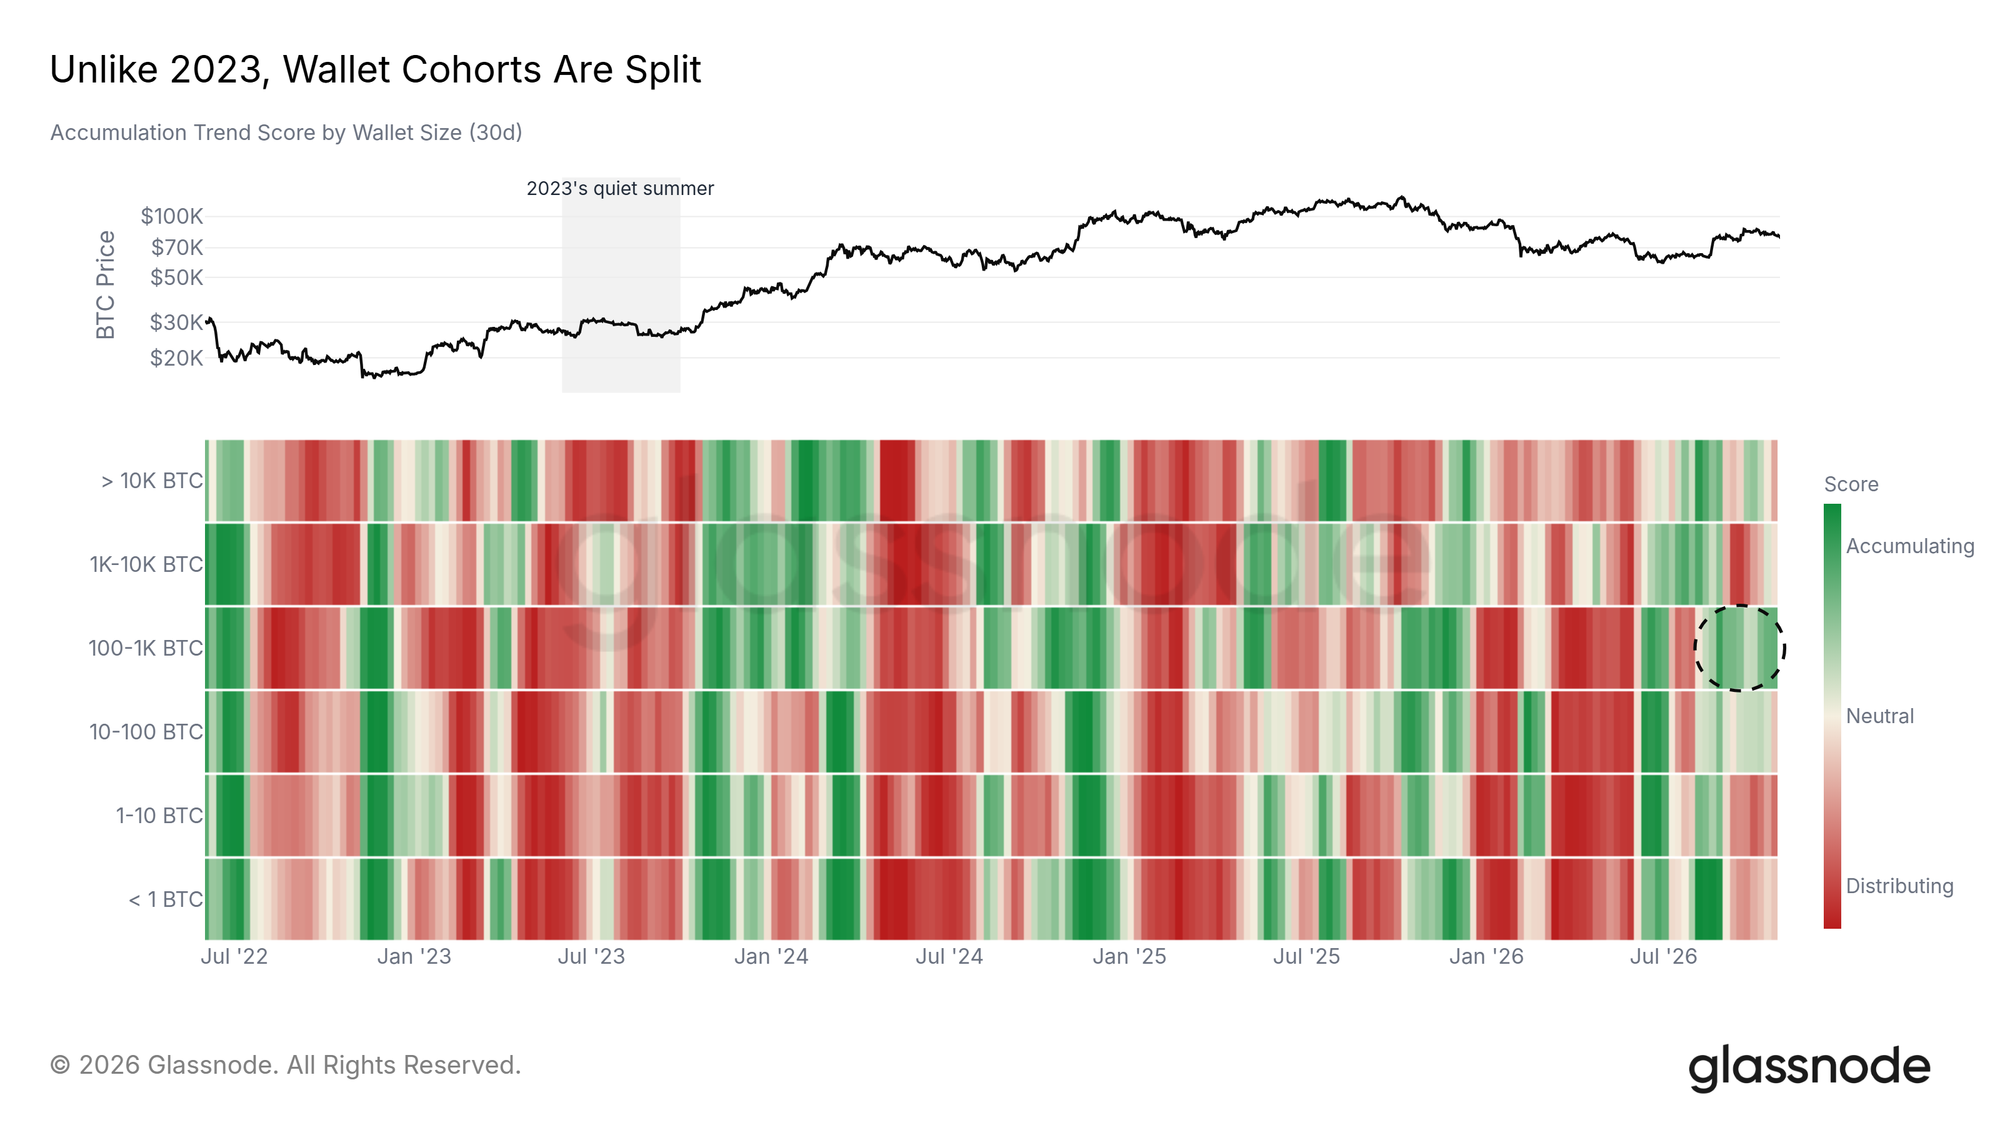
The Accumulation Trend Score, which tracks whether wallets of each size are buying or selling, shows the 100 to 1K BTC wallets as this month's steadiest buyers. They are still adding today. Wallets holding 10 to 100 BTC and above 10K BTC also added for much of the month, but have slowed in recent days. The other groups have been reducing.
That is a better picture than in summer 2023, when every group was reducing. More groups joining the 100 to 1K BTC wallets would point to broader demand behind the rebound.
Volatility at 2023 Levels
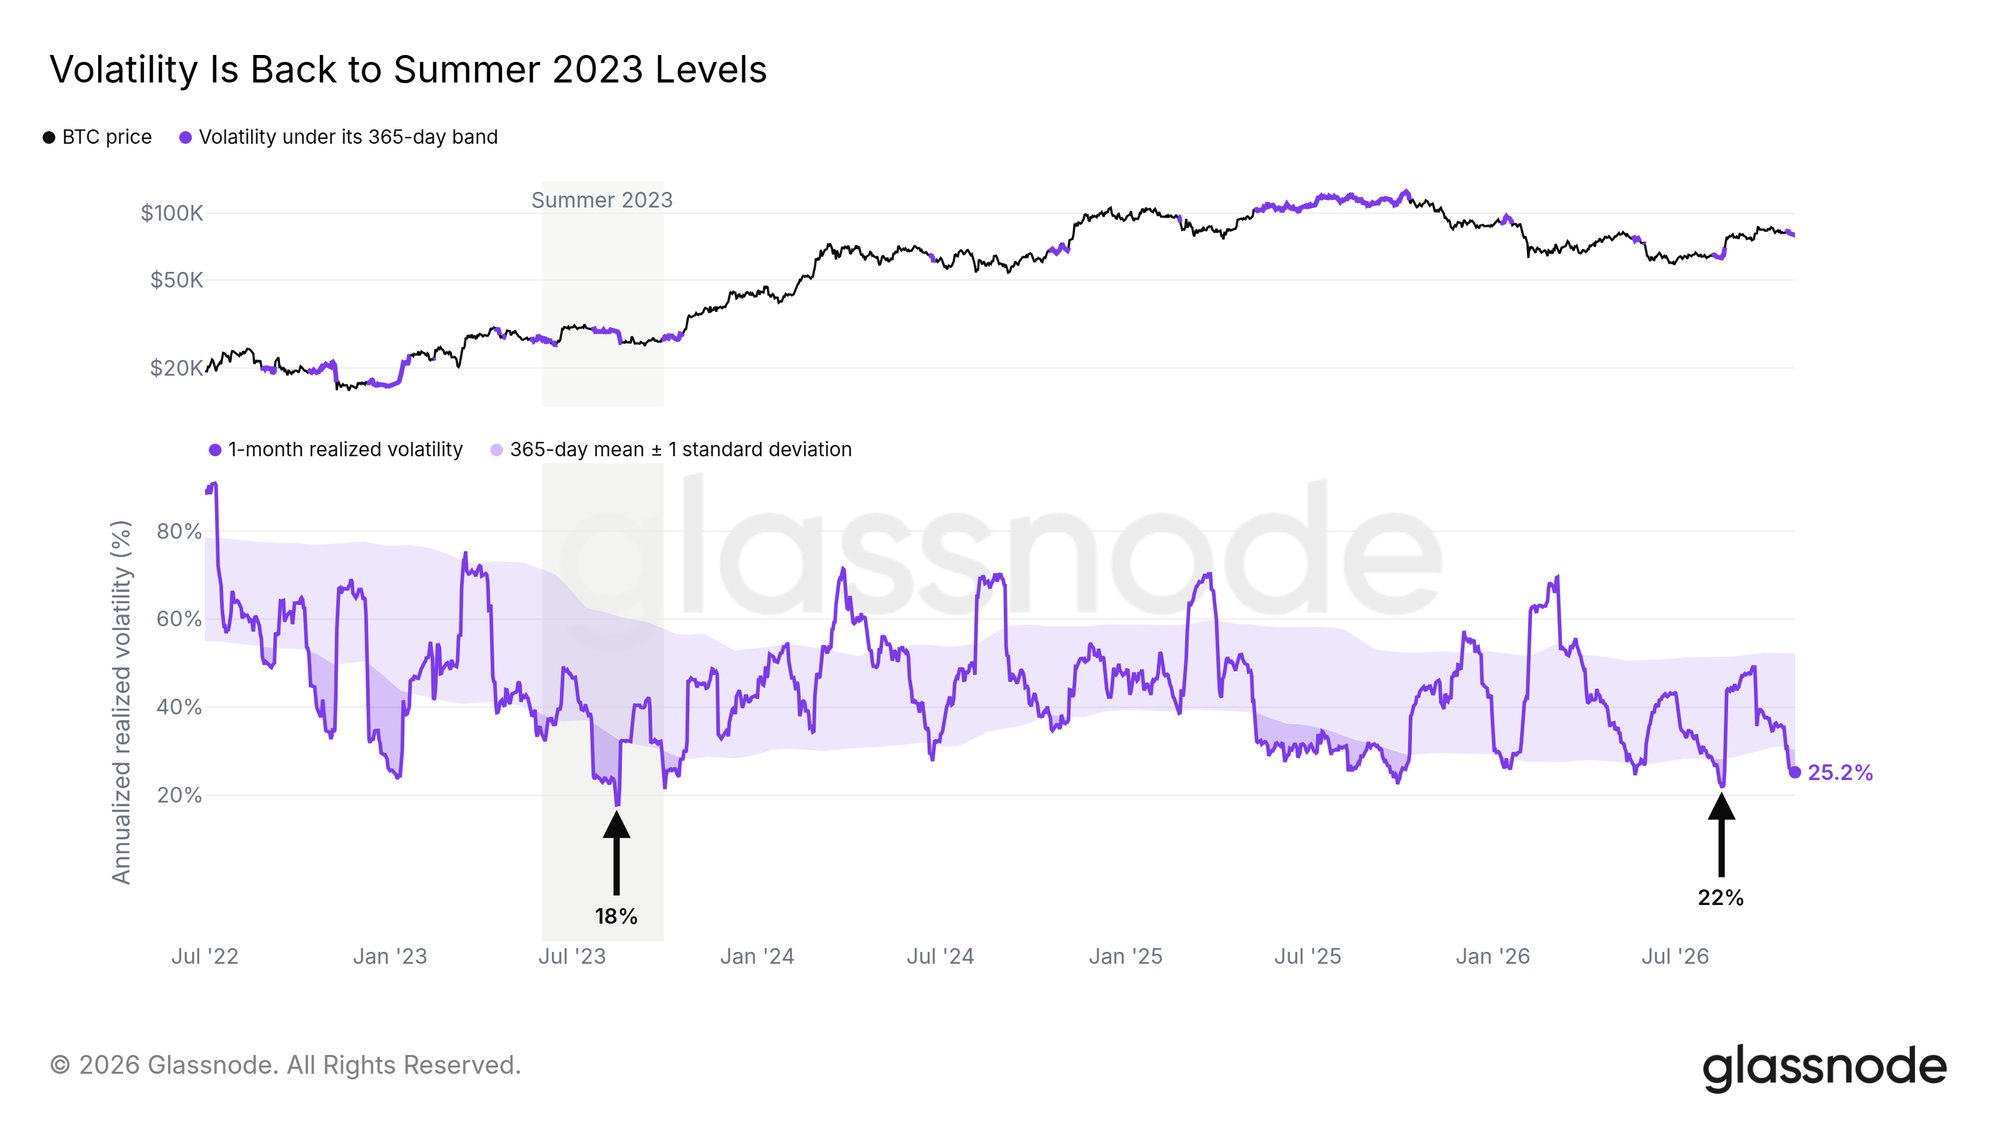
One-month Realized Volatility, the annualized size of daily price moves over the past month, has dropped to about 25%. That is below its usual range of the past year and back to the levels of summer 2023, when it bottomed at 18% in August. Since 2015, Bitcoin has been calmer than this on only about 5% of days.
The last two lows, 18% in August 2023 and 22% in August 2026, each came days before a sharp move, down in 2023 and up in 2026. If volatility stays this low into the Fed decision on October 28, the decision could set off the next move.
Losses Keep Shrinking
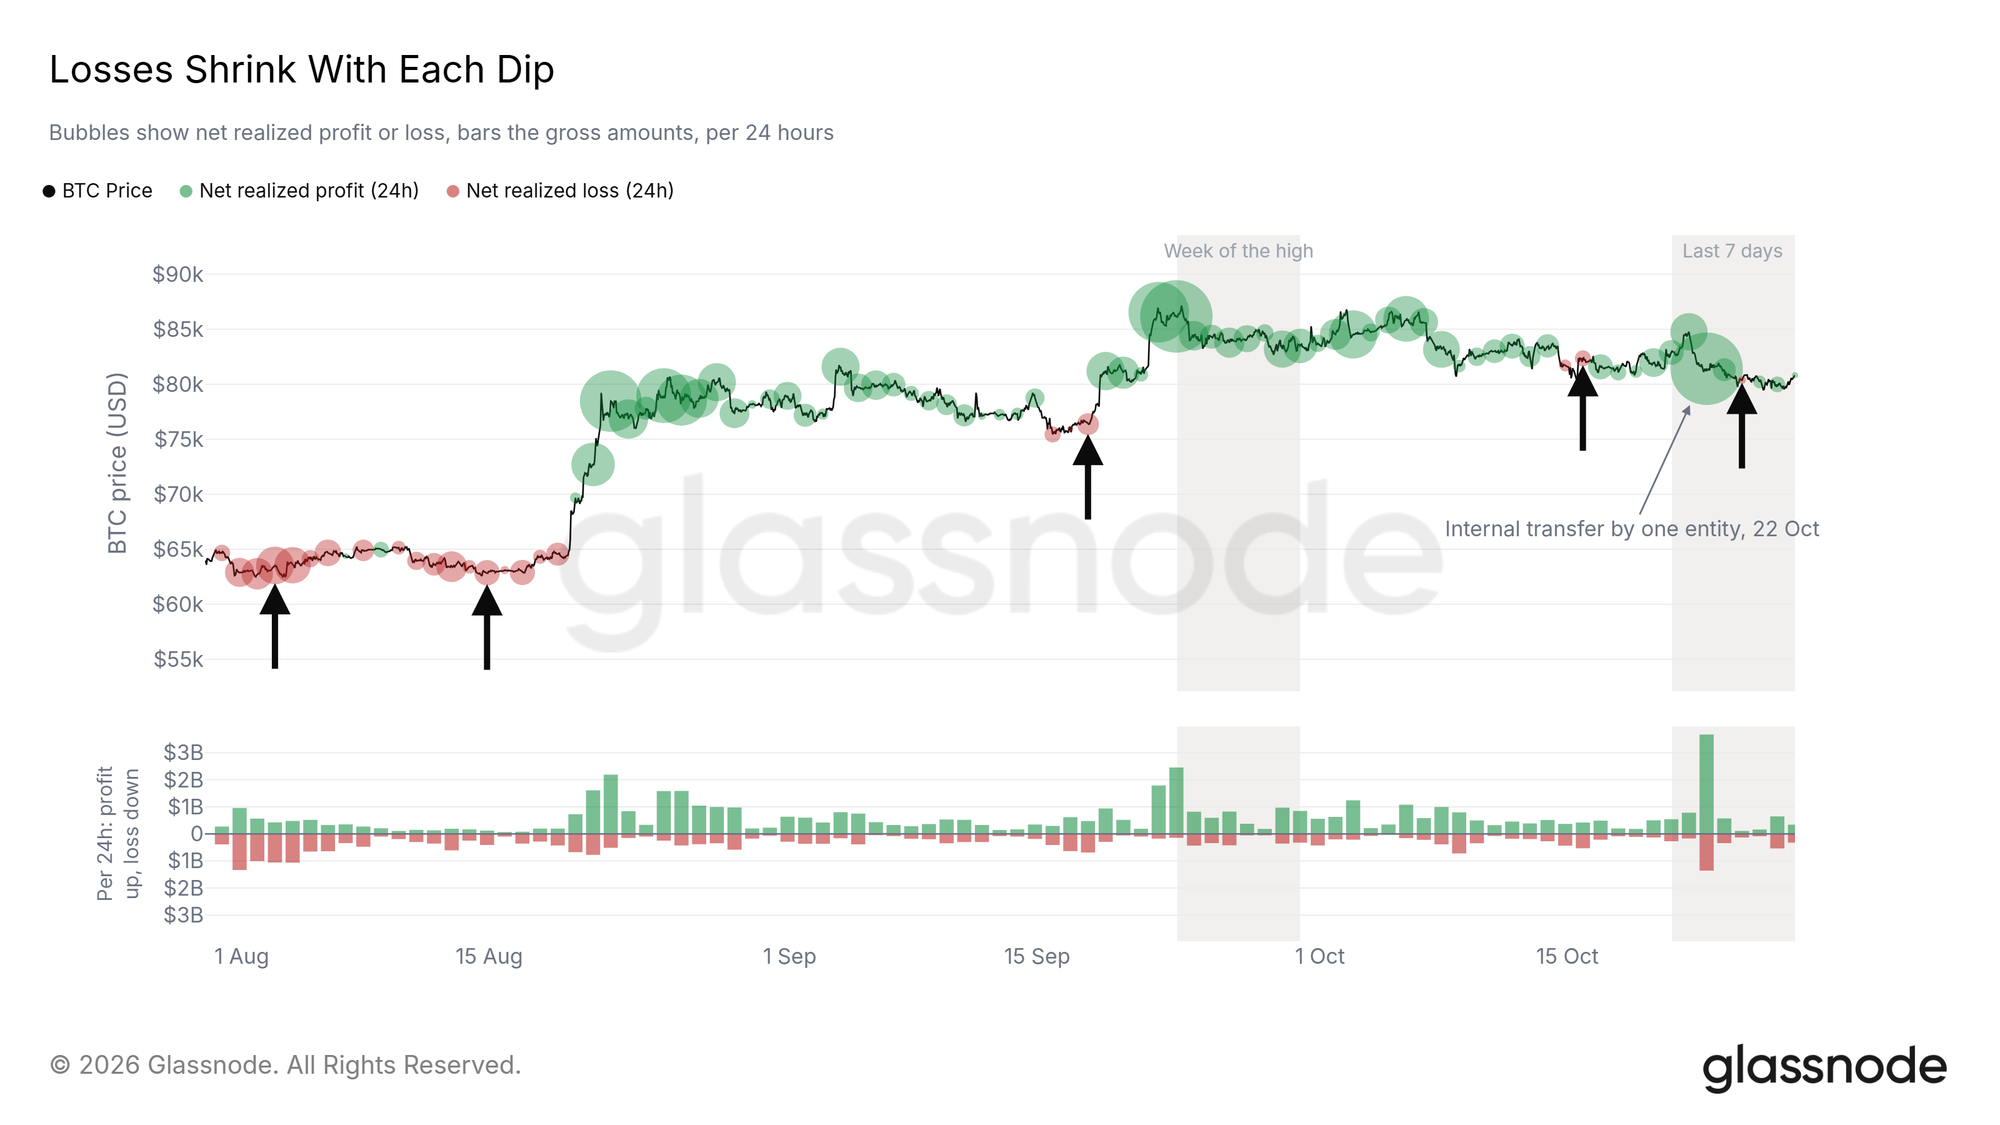
Holders have locked in smaller losses with each dip since August. At the August low, realized losses outweighed profits by about $630M in a day. Around the October 24 sweep, the largest daily net loss was about $27M. This suggests fewer holders are willing to sell at a loss as price dips.
Note that the spike on October 22 is one entity moving coins between its own wallets. On the standard measure, that lifted Realized Profit to about $3.7B in a single day, and Realized Loss to about $1.4B, although nothing was sold. Our entity-adjusted data, which nets out such moves, shows profit taking at about $260M a day this week. That is still about half its pace in the week of the September high. Larger losses on the next dip would show sellers returning.
Traders Turn to Stocks
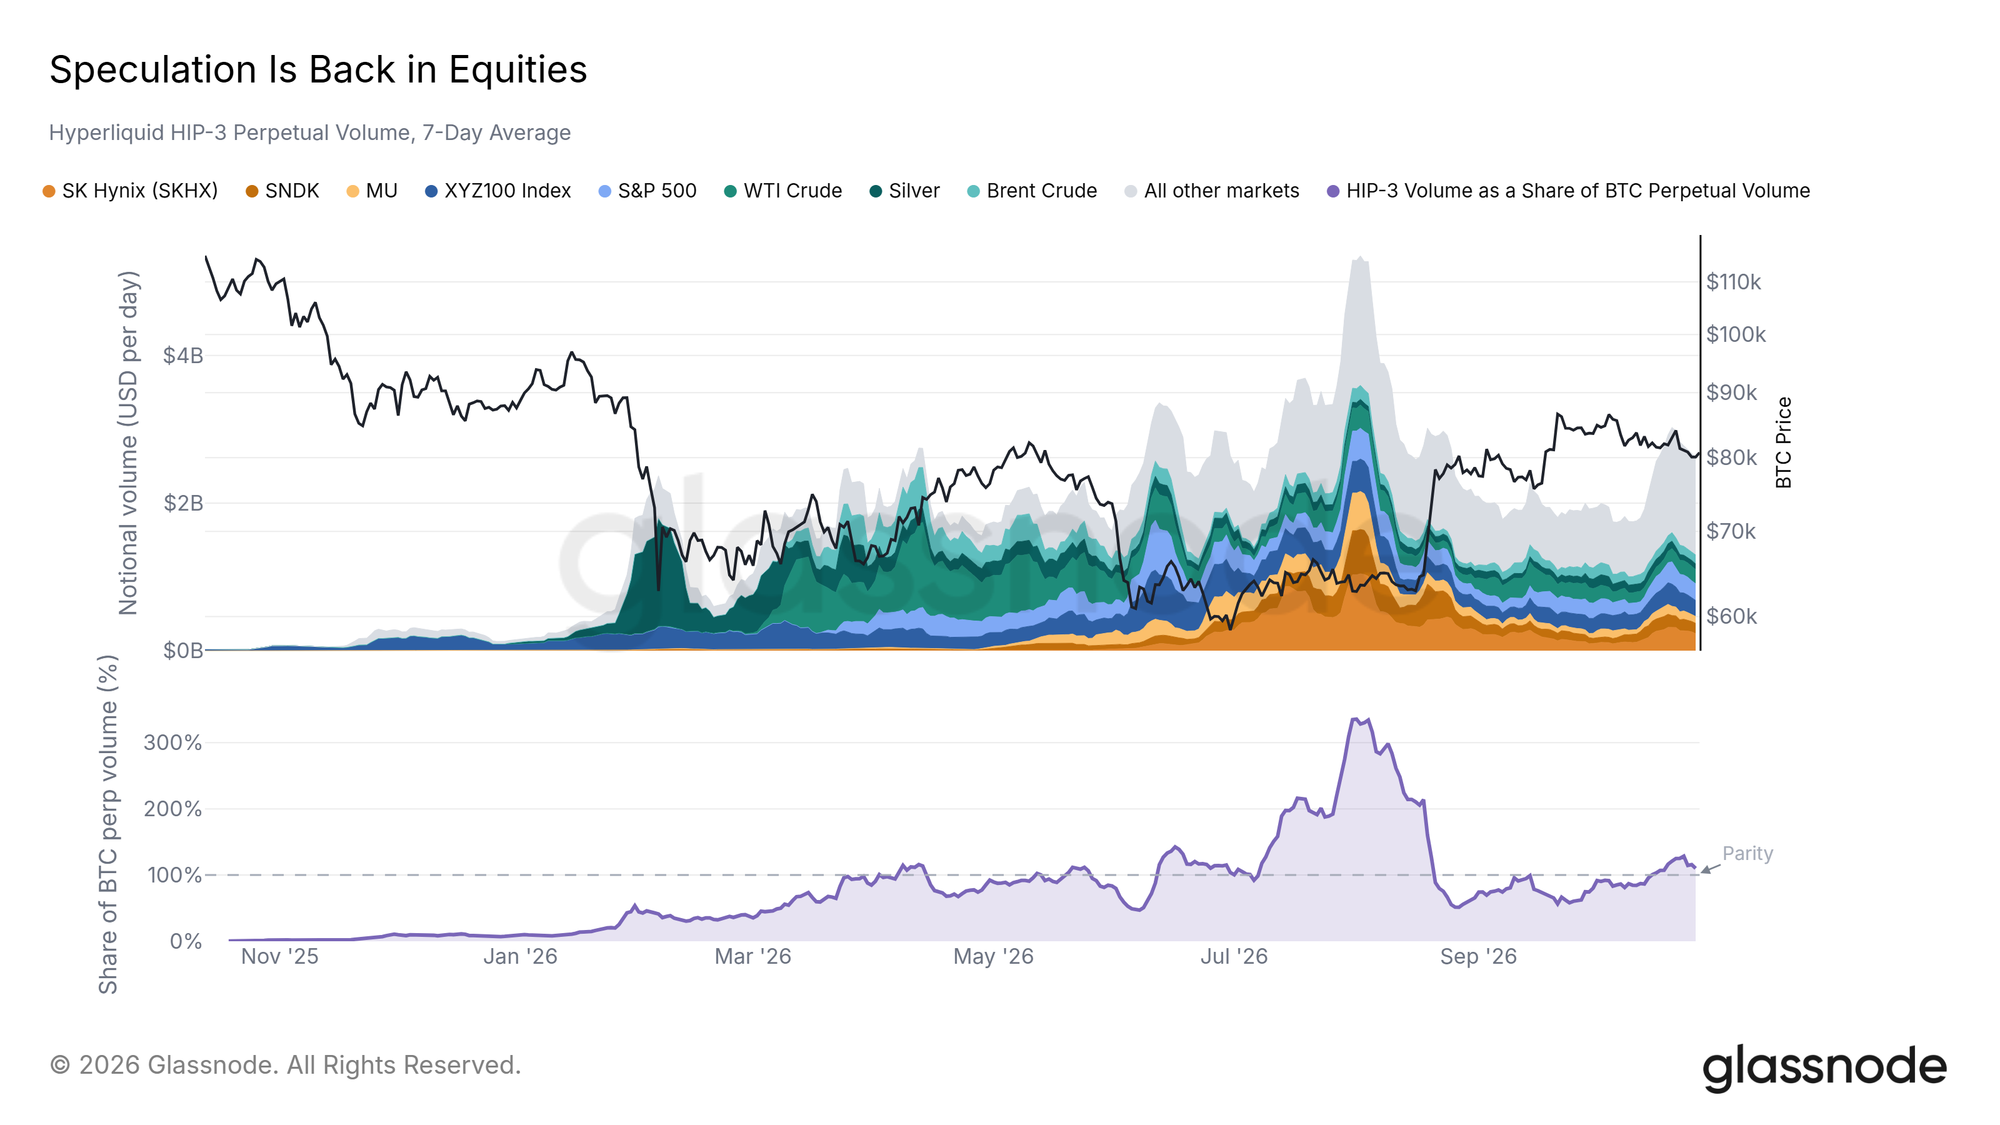
On Hyperliquid, HIP-3 markets let traders bet on stocks, indices and commodities with perpetual futures, contracts with no expiry date, the same kind they use for crypto. Over the past week, these markets traded about $2.6B a day, according to Hyperliquid's public data. That is more than Bitcoin perpetuals on the same venue, at about $2.4B.
In early August, HIP-3 volume ran at more than three times Bitcoin's. It fell to about half by late August, after the squeeze, and is now back above it. The most traded single markets are SK Hynix, the S&P 500 and a tech index, followed by crude oil. Should this volume keep growing while Bitcoin perpetual volume stays flat, it would show speculative money still favoring stocks.
Altcoin Breadth Fades
Among the top 100 altcoins, the share trading above their 200-day average peaked at 88% on October 4, above its early 2023 high of 80%. It has since dropped to 66%, and across the wider top 500 it has fallen to 42%. In 2023, breadth peaked in February, bounced during the PEPE and BRC-20 run in April, and faded through a quiet summer. This year the peak came about a month after the Robinhood Chain meme run marked on the chart.
The drop since October suggests the altcoin rally is narrowing. If breadth keeps falling as Bitcoin holds its range, it would show risk appetite fading in altcoins first.
Conclusion
Bitcoin is range-bound and quiet. Demand is thin, with ETF flows netted out and few wallet groups adding, but selling is light too, with smaller losses at each dip. Below lie the bids at $78K-79K and the True Market Mean at $77.9K, and above, the $84K-85K band. Last week we said a daily close above $87.5K, with ETF inflows repeating on rising volume, would show demand absorbing the supply overhead. Daily closes back above $85K would be the first step. A daily close below the True Market Mean would leave the Short-Term Holder Cost Basis at $75.8K as the next support. With volatility this compressed, the Fed decision on October 28 is the next event to watch.
Data as of October 27, 2026 for price, the order book and hourly on-chain data, and as of October 25 or October 26 for daily on-chain metrics, ETF flows and Hyperliquid. The macro series show the September releases. The most recent daily points remain subject to revision.
Disclaimer: This report does not provide any investment advice. All data is provided for informational and educational purposes only. No investment decision shall be based on the information provided here, and you are solely responsible for your own investment decisions.
Exchange balances presented are derived from Glassnode’s comprehensive database of address labels, which are amassed through both officially published exchange information and proprietary clustering algorithms. While we strive to ensure the utmost accuracy in representing exchange balances, it is important to note that these figures might not always encapsulate the entirety of an exchange’s reserves, particularly when exchanges refrain from disclosing their official addresses. We urge users to exercise caution and discretion when utilizing these metrics. Glassnode shall not be held responsible for any discrepancies or potential inaccuracies.